 |
Sea Isle
City Taxpayers Association It's your City. It's your money. It's your future! To subscribe to SICTA e-mail Alerts, join SICTA or contact us, visit the About SICTA page! |
|
|
Sea Isle
City Taxpayers Association It's your City. It's your money. It's your future! To subscribe to SICTA e-mail Alerts, join SICTA or contact us, visit the About SICTA page! |
|
Are you interested in a better understanding of how your property assessment fits into the bigger picture? Would you like some greater comfort that your tax basis is reasonable? If so, read on! The links below
take you to the data, but we really do recommend that you read
the analysis below before you dive in!
|
|
[Due to
the limitations of Web page design and the Webmaster's skill
level, this page is more readable when viewed as a
PDF document. The text and charts below are identical,
but the formatting isn't nearly as good.]
We stress that this information is already
publicly available by visiting either the Tax Assessor office or This format to the information was not
readily available during the revaluation process.
Our belief is that most taxpayers want assurance that
assessments result in reasonable and consistent values across
the City. We
believe that the following information will give them some
greater comfort, although with 7000+ lots/owners, there are sure
to be differences of opinion and unique situations.
We suggest that the City can bolster
taxpayer confidence, by providing similar information during our
next revaluation.
Data Description - In researching this project, we
learned that it can be difficult to obtain electronic databases
of assessed values for selected historical points in time.
For any particular property, the assessor’s office can
manually track historical changes, but computerized database
files for all lots are generally only produced if there is a
request for the information. We were lucky enough to have obtained two
snapshots that were reasonably close to the
If you have any questions about a particular
property, we suggest that you review the actual tax records in
the Assessor’s office.
Using the Detailed Files - We hope
that you find the accompanying property data files useful,
interesting and will be able to better appreciate your property
assessment! We are
providing the same file in both PDF and Excel formats, so that
everyone can easily access the information depending on their
computer capabilities. We understand and expect that one’s natural
instinct will be to first search for your own property and
compare it to the immediately surrounding area.
The information allows you to find any property by paging
down through the information.
However, we think you will quickly want to use some other
computer “tricks” as your curiosity leads to asking additional
questions.
Please note that we
are providing this information for personal use only.
By using the files, the user agrees that they will not be
used for any commercial purposes.
Before you delve into 7000+ individual
properties, we want to provide some broader perspectives for
you. Overall Changes – Sea Isle’s property lots are identified as being residential, commercial or tax-exempt. The following table displays a summary picture of the overall assessments for 2007, 2008, as well as the percentage change in assessed values (please see the data description section for important considerations in understanding the information).
For non-exempt properties, Sea Isle’s overall
revaluation change was roughly 31%, bringing the overall
non-exempt assessments to roughly $4.8B.
By far, land assessments makes up the lion’s share of
property values, which for non-residents taxpayers is probably
the reverse situation from your home town.
Unsurprisingly for a shore community, land has increased
much faster then improvements (i.e. buildings) since our prior
assessments. Residential lots are by far the bulk of our
property values, as is evident by any tour of the City.
While commercial and tax-exempt lots are included in our
detailed files, the rest of our summaries will focus purely on
the residential lots.
Residential Properties Chart
–
Each residential property is displayed on this chart as a single
point, based on its assessed value and its 2008 revaluation
change. While there
is clear variation, larger properties tended to have larger
revaluation changes. 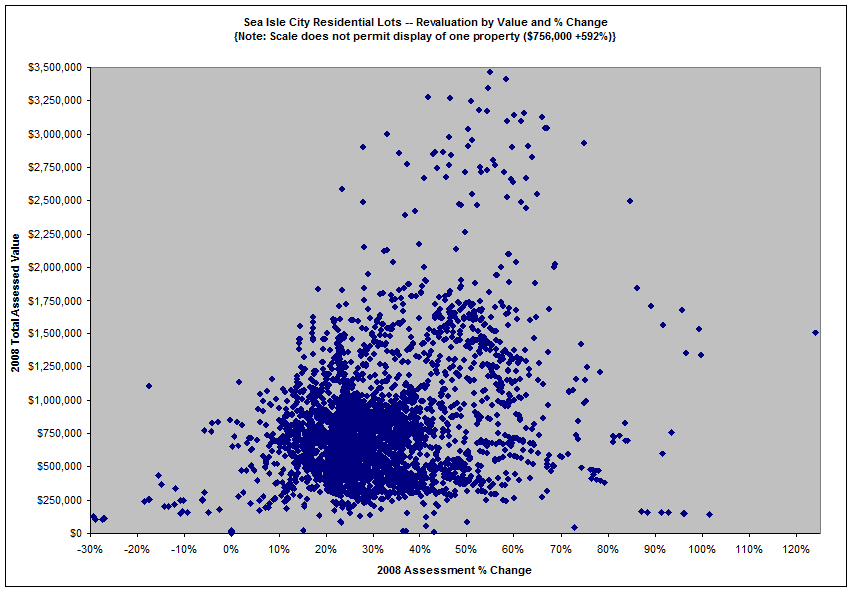
Assessments by Size Chart
– The following chart group individual properties in different
size categories based on their 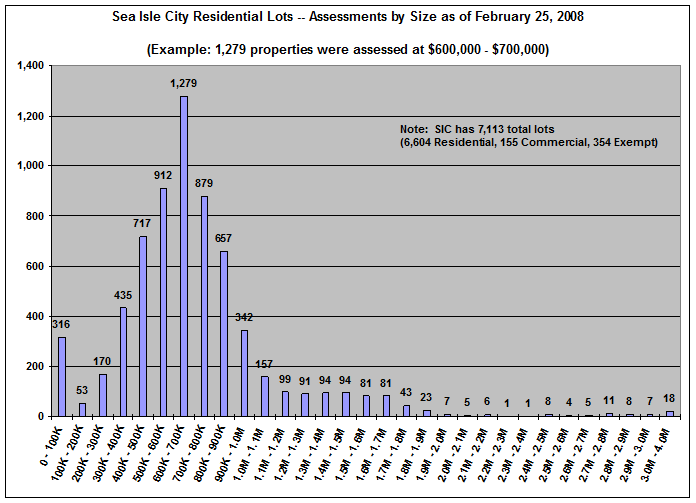 Most of our properties are centered on the
$600K-$700K category with the numbers falling off symmetrically
as you move to smaller or larger sizes.
At the lower end of the scale, there were 316 properties
under $100,000.
Many of these are undeveloped lots (i.e. no building)
which are assessed at very small values, or condominium
apartments. At the
upper end of the scale, there were 18 properties assessed at
$3,000,000 to $4,000,000.
Many of these are the beachfront properties along
Percentage Change Chart - The
following chart group properties by size of their revaluation
percentage change.
We have again lumped together the properties in selected
intervals for ease of display. 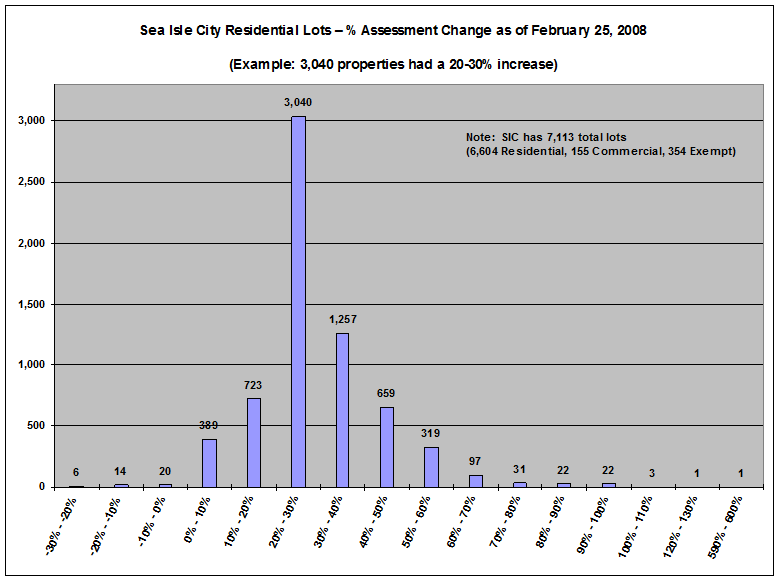 |
||||||||||||||||||||||||||||||||||||||||||||||||||||||||||||||||||||||||||||||||||||||||||||||||||||||||||||||||||||||||||||||||||||